
Job Quality
Job Quality and Worker Benefits
What is a Quality Job?
Amid a continuous trend of elevated costs for necessities, many U.S households are finding it increasingly difficult to cover typical household expenses.[1] This financial strain has eroded the stability that jobs have historically provided, highlighting the critical importance of job quality in today’s economy.
But what does it mean to have a quality job? A quality job could mean access to good pay and employer-sponsored benefits, generous paid leave, and opportunities for career growth and advancement. This concept could also describe a positive company culture or safe working conditions. However, some of these attributes fail to consider whether working-class employees are participating or “taking up” these benefits that comprise the definition of job quality.

Benefit Participation Drives Employee Retention
The Lafayette Square Institute emphasizes job quality components such as core benefits participation and the strategies and supplemental resources to increase core benefit participation. Workplace benefits are essential, providing measurable and impactful support that benefits both employees and employers. Beyond wages, employee benefits remain a primary way to support workers, increase retention, and reduce turnover. Nearly half of employees consider leaving their jobs due to confusion or dissatisfaction with benefits, while 78% are more likely to remain if they are satisfied with benefit offerings.[2]
However, the focus often remains on the availability of benefits rather than employee participation. For employers, encouraging benefits participation is a critical indicator of job satisfaction and retention. Of employees who are not enrolled in employer-sponsored retirement benefits, 63% are likely to leave within a year.[3]
Benefits Participation Gaps for Small Businesses and Lower-Income Earners
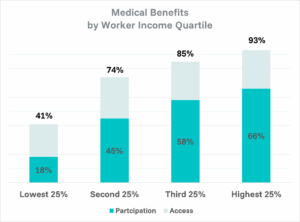
Despite the importance of benefits, there are notable disparities in medical and retirement participation for small businesses (companies with less than 500 employees) and low-to-moderate income[4] (LMI) workers. These groups experience higher turnover rates[5] and lower benefits participation, posing significant challenges for job quality across large segments of the workforce. In 2023, over 63 million were employed by businesses with headcounts fewer than 500[6] and 92million (27%) Americans are considered LMI.[7]
From consistent with historic trends, in 2025 small businesses offered medical and retirement benefits at lower rates than larger companies and low-earing workers are way less likely to have access to and participate in such plans[8]
2025 Access to and Participation in Benefits for Private Companies by Size and Worker Income


A roadmap for increasing SMB job quality and benefits participation for LMI workers
What can philanthropy do?
- Support job quality innovations and projects that improve job quality and benefits participation
- Support the development of a state and federal policy agenda to improve LMI job quality and benefits participation for SMBs
- Leverage their investment platform as asset allocators to require job quality disclosures and interventions across their portfolio
What can asset managers and general partners (GPs) do?
- Examine benefit participation data and turnover for portfolio companies
- Identify areas of high turnover and low benefit participation
- Develop a human capital strategy to improve participation
What can limited partners (LPs) and asset allocators do?
- Require GPs to baseline employee turnover at portfolio companies and develop action plans for improving retention and mobility
- Require GPs to collect data on the share and number of LMI workers across portfolio companies
- Require GPs to collect and report human capital data including benefits participation that is disaggregated by job type and wages

Appendix:
Company Size |
Medical BenefitTake-Up Rate (%) |
Retirement BenefitTake-Up Rate (%) |
||||||
2022 |
2023 |
2024 |
Net Change |
2022 |
2023 |
2024 |
Net Change |
|
All Private Companies |
66% |
64% |
63% |
-3% |
75% |
75% |
73% |
-2% |
Private Companies,1-49 Workers |
63% |
61% |
58% |
-5% |
68% |
70% |
70% |
+2% |
Private Companies,50-99 Workers |
61% |
60% |
58% |
-3% |
72% |
70% |
65% |
-7% |
Private Companies,100-499 Workers |
68% |
65% |
66% |
-2% |
74% |
73% |
70% |
-4% |
Private Companies,500+ Workers |
72% |
71% |
68% |
-4% |
86% |
86% |
86% |
0% |
Source: Bureau of Labor Statistics |
||||||||
Company Size |
Medical BenefitTake-Up Rate (%) |
Retirement BenefitTake-Up Rate (%) |
||||||
2022 |
2023 |
2024 |
Net Change |
2022 |
2023 |
2024 |
||
Lowest 25% Earners |
52% |
52% |
45% |
-7% |
52% |
52% |
51% |
|
Second 25% Earners |
63% |
61% |
60% |
-3% |
69% |
70% |
69% |
|
Third 25% Earners |
70% |
68% |
69% |
-1% |
80% |
81% |
79% |
|
Highest 25% Earners |
74% |
71% |
71% |
-3% |
89% |
90% |
88% |
|
Source: Bureau of Labor Statistics |
||||||||